Give Your Gadgets a Proper Goodbye
Most old electronics never make it to a certified recycler. See why that matters, and where yours can go instead.
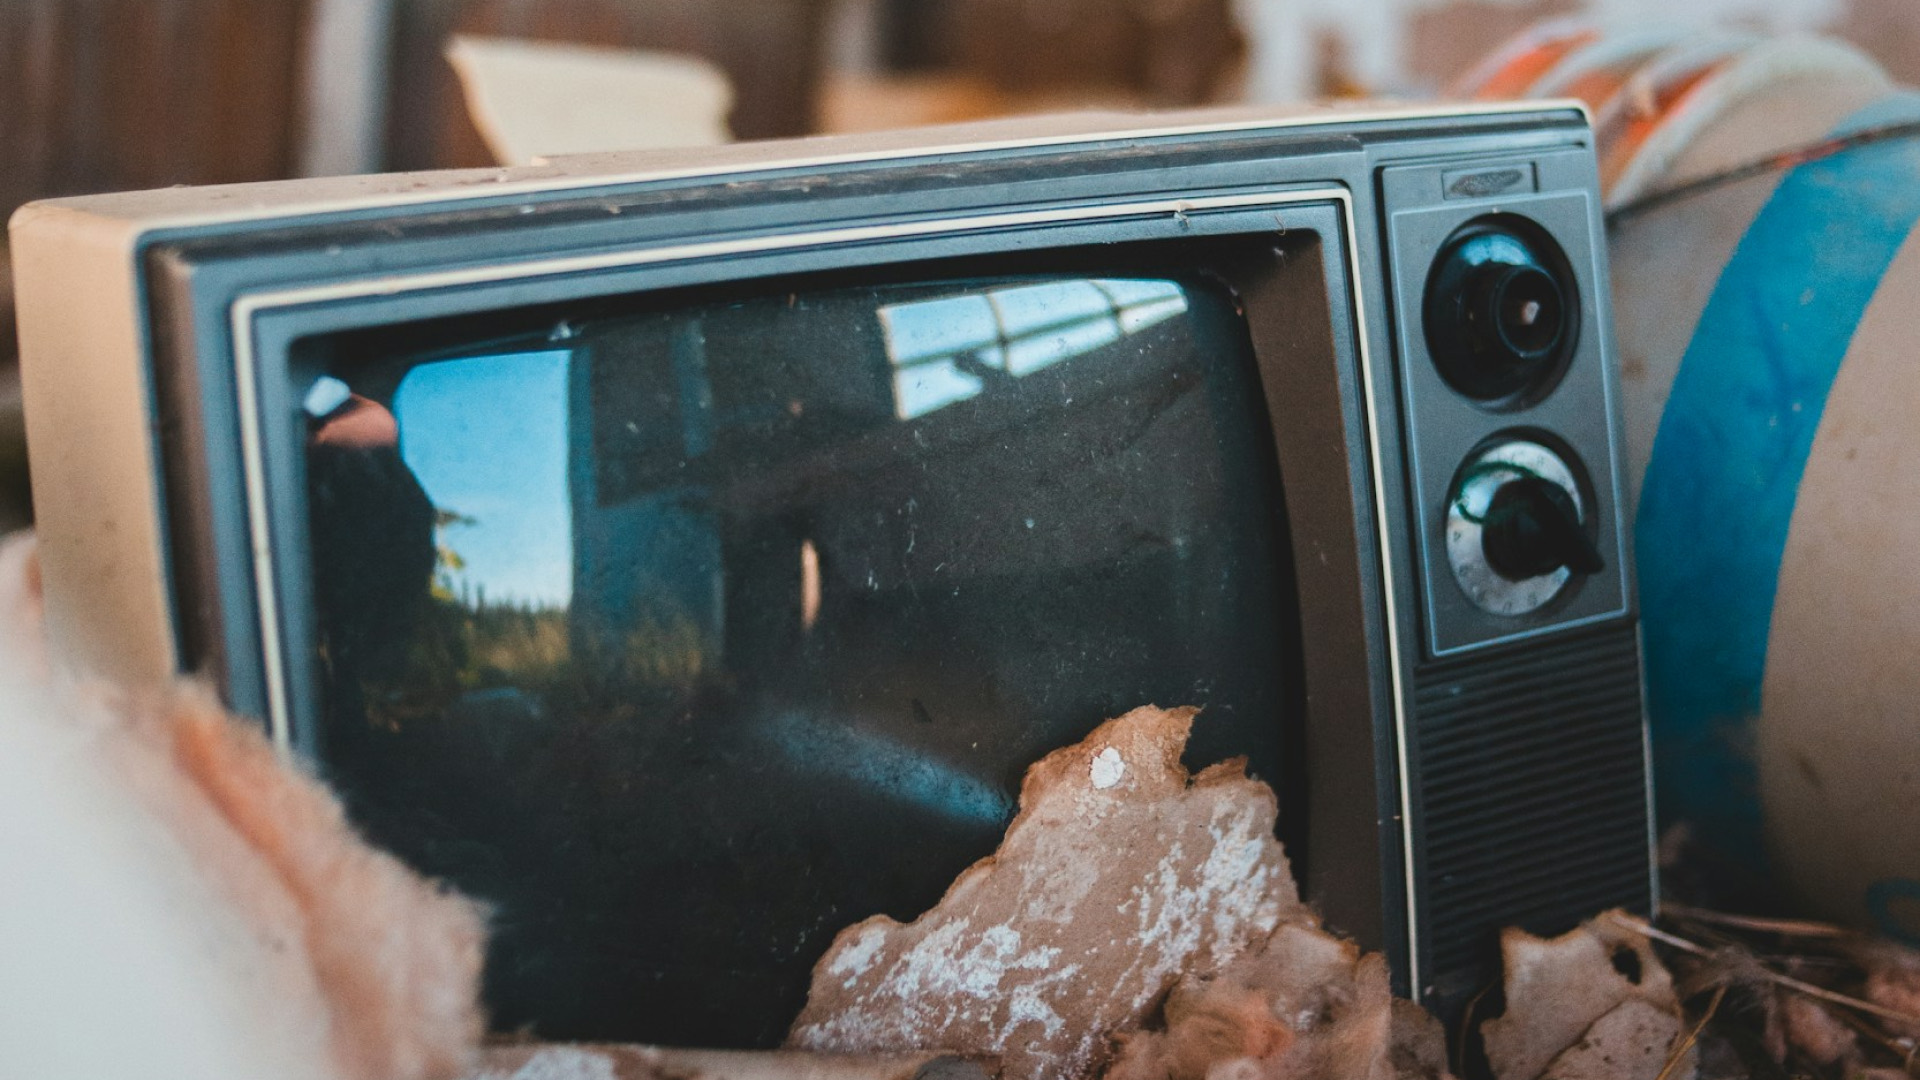
Why e-waste keeps growing, and what one return at home can do
Old phones, chargers and laptops pile up faster than we use them, and many end up forgotten in drawers and closets. Worldwide, e-waste is still growing, and only a small share of it is collected safely.
This story starts with the global numbers and ends at home, where returning a single phone or small appliance sends its materials back into use and keeps its toxins out of landfills.
The scale
Each year brings more new electronics, and more old ones thrown away. Between 2014 and 2022, global e-waste grew from 44.4 to 61.9 billion kg.
Global e-waste generated, 2014–2022
* 2020 and 2021 are Statista estimates. Source: Global E-waste Monitor 2024, via Statista.
| 2014 | 44.4 |
|---|---|
| 2015 | 46.4 |
| 2016 | 48.2 |
| 2017 | 50 |
| 2018 | 51.8 |
| 2019 | 53.6 |
| 2020 (Statista estimate) | 57.6 |
| 2021 (Statista estimate) | 59.8 |
| 2022 | 61.9 |
| 2030 (projection) | 82 |
The collection gap
Where the world's e-waste went, 2022
1 tile = 1 billion kg; 62 tiles = all e-waste generated in 2022. Source: Global E-waste Monitor 2024.
| Flow | Amount |
|---|---|
| Formally collected and recycled | 13.8 billion kg |
| Collected outside formal systems, high-income countries | 16 billion kg |
| Handled informally in lower-income countries | 18 billion kg |
| Thrown away, mostly landfilled | 14 billion kg |
Out of 62 billion kg of e-waste in 2022, about 13.8 billion kg entered verified collection and recycling. The rest was not tracked, or was handled without safeguards.
13.8 billion kg of e-waste is documented as formally collected and recycled in an environmentally sound manner.
16 billion kg of e-waste is estimated to be collected and recycled outside formal systems in high and upper-middle income countries with developed e-waste management infrastructure.
18 billion kg of e-waste is estimated to be handled in low and lower-middle income countries with no developed e-waste management infrastructure, mostly by the informal sector.
14 billion kg of e-waste is estimated to be disposed of as residual waste, most of which is landfilled.
The risk
Why is informally collected e-waste dangerous?
The other 78% is handled outside formal collection and recycling. Without proper handling, toxic materials from old devices leak into the air, soil and water, and into the people who live nearby.
Mercury
58,000 kg
of mercury is released into the environment every year through noncompliant e-waste handling.
Plastics
45 million kg
of plastics containing brominated flame retardants are released the same way, every year.
Outside formal recycling
78%
of the world's e-waste in 2022 was not documented as formally collected and recycled.
Where we live
Where we live affects two things. One is how much e-waste we generate. The world average is 7.8 kg per person. In the United States, it is 21.3 kg, putting it among 20 high-income countries that generate nearly three times the average.
E-waste generated by country, 2022
Circle area = e-waste generated, in billion kg. Source: Global E-waste Monitor 2024, Table A2.4.
| Country | Generated (million kg) | Per person (kg) | Collection rate |
|---|---|---|---|
| China | 12066 | 8.5 | 16.2% |
| United States | 7188 | 21.3 | 56.4% |
| India | 4137 | 2.9 | 1.4% |
| Japan | 2638 | 21.2 | 23.3% |
| Brazil | 2443 | 11.4 | 3.2% |
| Russia | 1910 | 13.2 | 6.3% |
| Indonesia | 1886 | 6.9 | No data |
| Germany | 1767 | 21.2 | 54.1% |
| United Kingdom | 1652 | 24.5 | 30.4% |
| Mexico | 1499 | 11.8 | 3.5% |
| France | 1445 | 22.4 | 59.6% |
| Italy | 1124 | 19 | 41.1% |
| Türkiye | 1077 | 12.7 | 17.4% |
| Spain | 935 | 19.6 | 42.3% |
| South Korea | 930 | 17.9 | 47.6% |
| Iran | 817 | 9.3 | No data |
| Canada | 774 | 20.2 | 12.7% |
| Thailand | 753 | 10.5 | 3.9% |
| Egypt | 692 | 6.3 | No data |
| Saudi Arabia | 617 | 17.1 | No data |
| Australia | 583 | 22.4 | 50.2% |
| Pakistan | 559 | 2.4 | No data |
| Philippines | 537 | 4.7 | No data |
| South Africa | 527 | 8.8 | 4.3% |
| Argentina | 517 | 11.4 | 2.8% |
| Poland | 517 | 13.5 | 80.8% |
| Vietnam | 516 | 5.3 | No data |
| Nigeria | 497 | 2.3 | No data |
| Taiwan | 463 | 19.4 | 31.4% |
| Malaysia | 411 | 12.2 | No data |
| Colombia | 388 | 7.5 | 1.3% |
| Netherlands | 387 | 22.1 | 59% |
| Ukraine | 385 | 8.9 | 8.1% |
| Bangladesh | 367 | 2.2 | No data |
| Algeria | 333 | 7.5 | No data |
| Venezuela | 303 | 10.8 | 0.3% |
| Iraq | 267 | 6.1 | No data |
| Belgium | 252 | 21.7 | 64.6% |
| Romania | 250 | 13 | 28.6% |
| Chile | 230 | 11.7 | 3.2% |
| Peru | 221 | 6.5 | 1.5% |
| Sweden | 221 | 21 | 68.4% |
| Switzerland | 204 | 23.4 | 63.2% |
| Kazakhstan | 196 | 10.2 | 6.3% |
| Greece | 194 | 18.6 | 30.2% |
| Portugal | 183 | 17.8 | 33% |
| United Arab Emirates | 178 | 18.9 | 3% |
| Morocco | 177 | 4.8 | No data |
| Austria | 175 | 19.6 | 76.1% |
| Sri Lanka | 175 | 8 | No data |
| Czechia | 173 | 16.5 | 68.7% |
| Hong Kong | 161 | 21.6 | 44.5% |
| Angola | 148 | 4.2 | No data |
| Israel | 148 | 16.5 | 48.9% |
| Norway | 145 | 26.8 | 73.9% |
| Hungary | 138 | 14.3 | 65.5% |
| Denmark | 131 | 22.3 | 60.3% |
| Uzbekistan | 128 | 3.7 | No data |
| Singapore | 121 | 20.3 | No data |
| Syria | 121 | 5.6 | No data |
| Finland | 118 | 21.3 | 75.9% |
| Belarus | 111 | 11.6 | 27.9% |
| Ecuador | 108 | 6 | 3.1% |
| Ireland | 103 | 20.6 | 65.4% |
| Sudan | 103 | 2.2 | No data |
| New Zealand | 101 | 19.6 | No data |
| Dominican Republic | 99 | 8.8 | No data |
| Libya | 94 | 13.8 | No data |
| Guatemala | 92 | 5.2 | 1.2% |
| Azerbaijan | 90 | 8.7 | 0% |
| Bulgaria | 90 | 13.2 | 83.9% |
| Bolivia | 89 | 7.3 | 2.7% |
| Ethiopia | 88 | 0.7 | No data |
| Kenya | 88 | 1.6 | No data |
| Tunisia | 85 | 6.9 | No data |
| Slovakia | 84 | 15.4 | 56.3% |
| Serbia | 81 | 11.1 | 38.5% |
| Myanmar | 76 | 1.4 | No data |
| Ghana | 72 | 2.2 | No data |
| Kuwait | 71 | 16.7 | No data |
| Oman | 71 | 15.7 | No data |
| Jordan | 69 | 6.1 | 2.3% |
| Costa Rica | 66 | 12.7 | 8.8% |
| Puerto Rico | 65 | 20 | No data |
| Tanzania | 61 | 0.9 | No data |
| Lebanon | 60 | 10.7 | 0.2% |
| Paraguay | 57 | 8.4 | No data |
| Democratic Republic of the Congo | 56 | 0.6 | No data |
| Croatia | 54 | 13.3 | 65.4% |
| Panama | 54 | 12.4 | 0.2% |
| Yemen | 49 | 1.5 | No data |
| Turkmenistan | 46 | 7.1 | No data |
| Qatar | 44 | 16.2 | 0.5% |
| Uruguay | 44 | 12.9 | 3% |
| Côte d'Ivoire | 42 | 1.5 | No data |
| Nepal | 42 | 1.4 | No data |
| El Salvador | 41 | 6.4 | 1.2% |
| Uganda | 41 | 0.9 | 0.5% |
| Lithuania | 37 | 13.4 | 45.1% |
| Honduras | 36 | 3.5 | 0.3% |
| Slovenia | 36 | 17 | 41.9% |
| Georgia | 34 | 8.9 | No data |
| Bosnia and Herzegovina | 33 | 10.1 | 14.8% |
| Cameroon | 33 | 1.2 | 0.3% |
| Afghanistan | 32 | 0.8 | No data |
| Laos | 27 | 3.6 | No data |
| Bahrain | 26 | 17.8 | No data |
| Cambodia | 25 | 1.5 | No data |
| Senegal | 25 | 1.5 | No data |
| Albania | 24 | 8.3 | No data |
| Trinidad and Tobago | 24 | 15.4 | No data |
| Botswana | 23 | 8.7 | No data |
| Zambia | 23 | 1.1 | No data |
| Armenia | 22 | 7.8 | No data |
| Latvia | 22 | 11.9 | 52.7% |
| Gabon | 21 | 8.7 | No data |
| Jamaica | 21 | 7.4 | 0.5% |
| Nicaragua | 21 | 3 | 0.5% |
| Moldova | 21 | 6.8 | 1% |
| North Macedonia | 21 | 10 | 16.2% |
| Mali | 20 | 0.9 | No data |
| Mongolia | 20 | 5.9 | No data |
| Mozambique | 20 | 0.6 | No data |
| Estonia | 19 | 14.2 | 65.3% |
| Madagascar | 19 | 0.6 | No data |
| Equatorial Guinea | 18 | 10.6 | No data |
| Burkina Faso | 17 | 0.8 | No data |
| Namibia | 17 | 6.8 | 0.2% |
| Zimbabwe | 17 | 1.1 | 0.2% |
| Congo | 16 | 2.7 | No data |
| Cyprus | 16 | 13 | 21.9% |
| Mauritius | 16 | 12.1 | 0.6% |
| South Sudan | 15 | 1.4 | No data |
| Benin | 14 | 1.1 | No data |
| Guinea | 14 | 1 | No data |
| Kyrgyzstan | 14 | 2.2 | No data |
| Niger | 14 | 0.5 | No data |
| Macao | 13 | 18.5 | No data |
| Luxembourg | 13 | 20.9 | 52.3% |
| Papua New Guinea | 13 | 1.3 | No data |
| Chad | 12 | 0.7 | No data |
| Haiti | 12 | 1.1 | No data |
| Mauritania | 12 | 2.7 | No data |
| Tajikistan | 12 | 1.2 | 0.9% |
| Malawi | 11 | 0.5 | No data |
| Rwanda | 10 | 0.7 | 20% |
| Brunei | 9 | 19.9 | No data |
| Somalia | 9 | 0.5 | No data |
| Burundi | 8 | 0.6 | No data |
| Iceland | 8 | 22.4 | 60% |
| Malta | 8 | 14.1 | 40% |
| Montenegro | 8 | 13 | 2.5% |
| Togo | 8 | 0.9 | No data |
| Bahamas | 7 | 17.7 | No data |
| Fiji | 7 | 7.2 | No data |
| Guyana | 7 | 8.1 | No data |
| Suriname | 7 | 11.1 | No data |
| Eswatini | 7 | 6.2 | No data |
| Sierra Leone | 6 | 0.7 | No data |
| Bhutan | 5 | 6.7 | 10% |
| Maldives | 5 | 10 | No data |
| Barbados | 4 | 14.7 | No data |
| Gambia | 4 | 1.4 | No data |
| Belize | 3 | 7.1 | No data |
| Cabo Verde | 3 | 5.3 | No data |
| Central African Republic | 3 | 0.6 | No data |
| Eritrea | 3 | 0.7 | No data |
| Lesotho | 3 | 1.3 | No data |
| Liberia | 3 | 0.6 | No data |
| Aruba | 2 | 20.7 | No data |
| Djibouti | 2 | 1.7 | No data |
| Saint Lucia | 2 | 11.4 | 1.5% |
| Timor-Leste | 2 | 1.6 | No data |
| Antigua and Barbuda | 1 | 13.3 | No data |
| Comoros | 1 | 1.5 | No data |
| Dominica | 1 | 8.9 | No data |
| Grenada | 1 | 10.4 | No data |
| Guinea-Bissau | 1 | 0.6 | No data |
| Saint Kitts and Nevis | 1 | 15 | No data |
| Saint Vincent and the Grenadines | 1 | 10.6 | No data |
| Samoa | 1 | 3.1 | No data |
| San Marino | 1 | 22.1 | No data |
| Seychelles | 1 | 13.5 | No data |
| Solomon Islands | 1 | 1.1 | No data |
| Kiribati | 0 | 1.3 | No data |
| Marshall Islands | 0 | 3 | No data |
| Micronesia | 0 | 1.9 | No data |
| Nauru | 0 | 6.3 | No data |
| Palau | 0 | 12.2 | No data |
| São Tomé and Príncipe | 0 | 1.9 | No data |
| Tonga | 0 | 4 | No data |
| Tuvalu | 0 | 2.4 | No data |
| Vanuatu | 0 | 1.2 | No data |
E-waste per person, 2022: the 20 highest countries
Source: Global E-waste Monitor 2024, Table A2.4.
| Name | kg per person |
|---|---|
| Norway | 26.8 |
| United Kingdom | 24.5 |
| Switzerland | 23.4 |
| Australia | 22.4 |
| Iceland | 22.4 |
| France | 22.4 |
| Denmark | 22.3 |
| San Marino | 22.1 |
| Netherlands | 22.1 |
| Belgium | 21.7 |
| Hong Kong | 21.6 |
| United States | 21.3 |
| Finland | 21.3 |
| Germany | 21.2 |
| Japan | 21.2 |
| Sweden | 21.0 |
| Luxembourg | 20.9 |
| Aruba | 20.7 |
| Ireland | 20.6 |
| Singapore | 20.3 |
| World average | 7.8 kg |
2.6–3.4×
the world average
20.3–26.8 kg per person, divided by the world average of 7.8 kg.
The other is how much of it is formally recycled. Europe recycles 42.8%, about twice the world rate of 22.3%. Northern America does better at 52%, yet nearly half of its e-waste still goes undocumented. In the rest of the Americas, it is under 4%.
Formally collected and recycled, by region, 2022
- Formally collected and recycled
- Not documented
Latin America & Caribbean is calculated from its sub-regions. Source: Global E-waste Monitor 2024, Table A2.2.
| Name | Formally collected and recycled (%) |
|---|---|
| Northern America | 52.1% |
| Europe | 42.8% |
| Oceania | 41.4% |
| Asia | 11.8% |
| Latin America & Caribbean | 2.8% |
| Africa | 0.7% |
| World average | 22.3% |
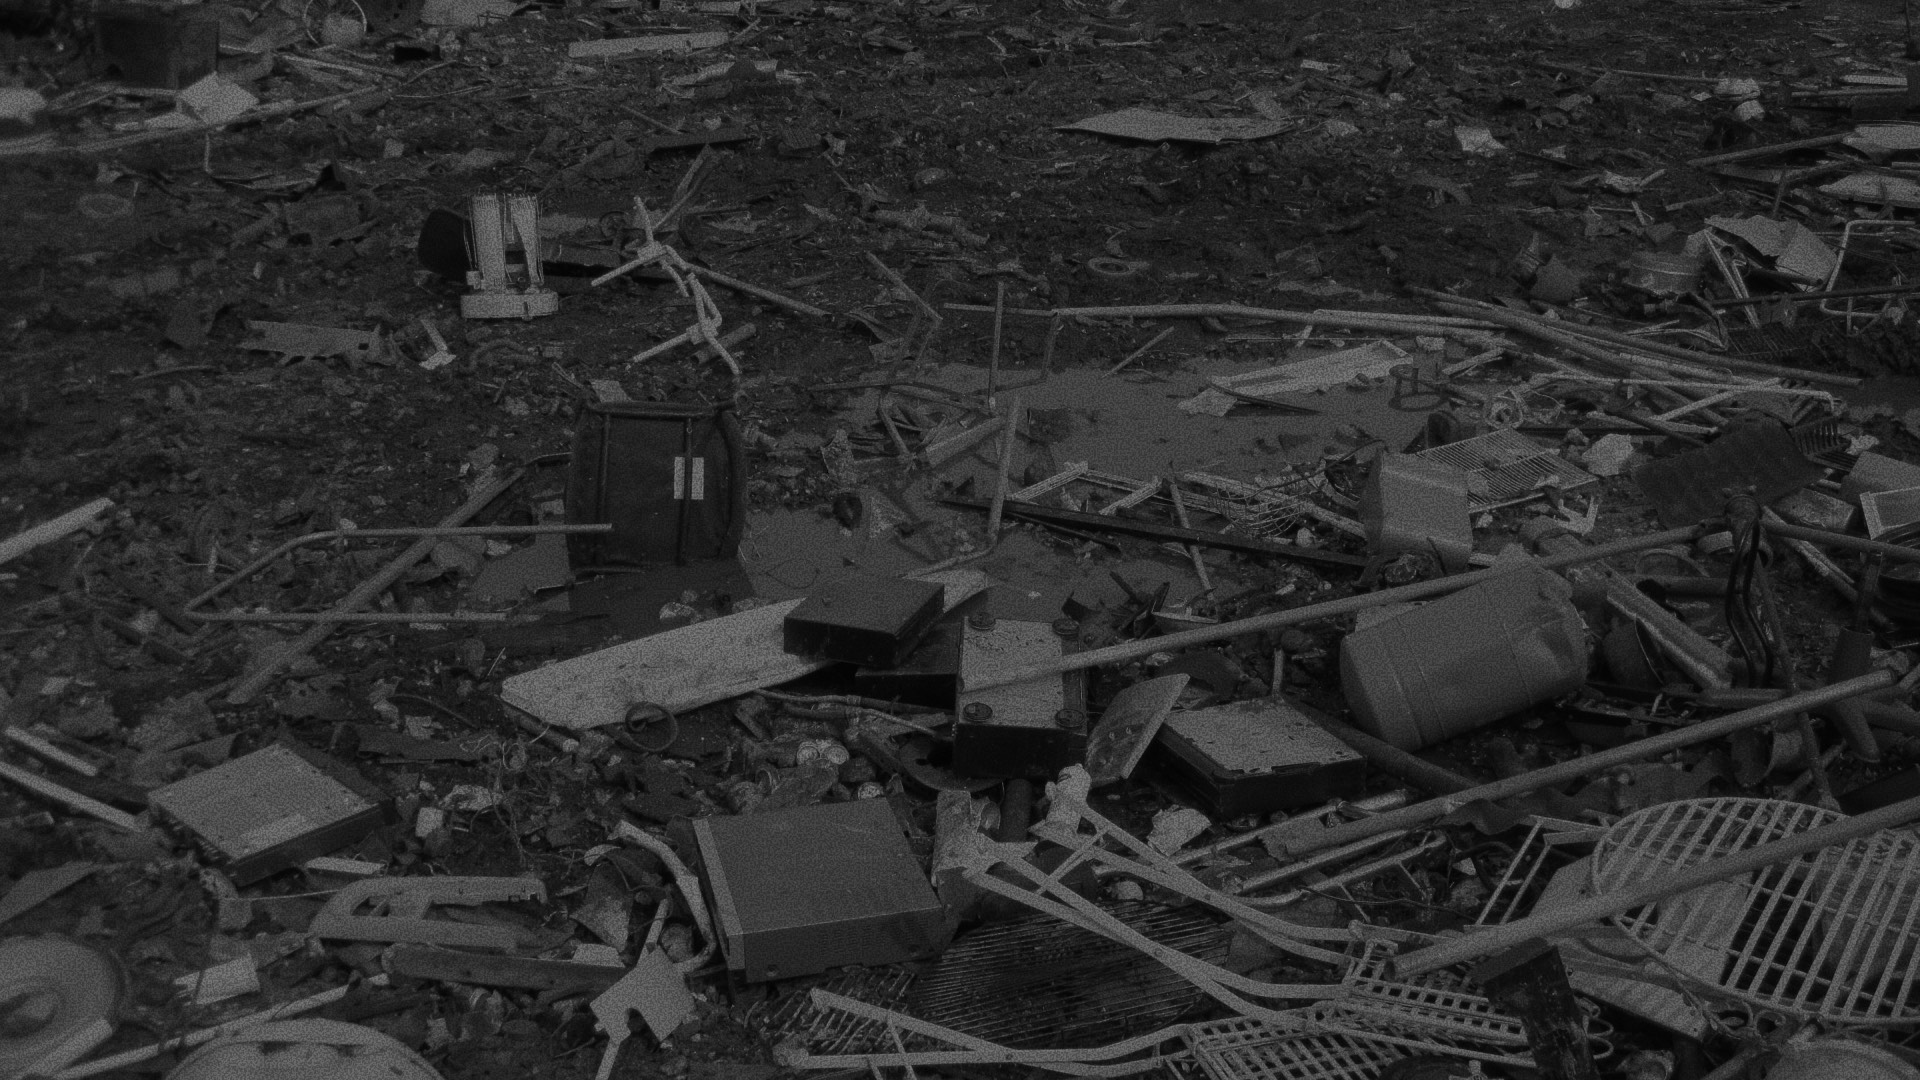
What we throw away
E-waste by category, 2022
- Generated in 2022
- Formally collected and recycled
Circle area = amount generated. Source: Global E-waste Monitor 2024.
| Category | Generated (billion kg) | Recycled (billion kg) | Rate |
|---|---|---|---|
| Small equipment | 20.4 | 2.4 | 12% |
| Large equipment | 15.1 | 5.1 | 34% |
| Temperature exchange | 13.3 | 3.6 | 27% |
| Screens & monitors | 5.9 | 1.5 | 25% |
| Small IT & telecom | 4.6 | 1 | 22% |
| Lamps | 1.9 | 0.1 | 5% |
| Photovoltaic panels | 0.6 | 0.1 | 17% |
E-waste falls into 7 groups, from washing machines to light bulbs.
Small equipment, like microwaves, toasters and vacuums, is the largest group at 20.4 billion kg.
Large equipment has the highest formal recycling rate, 34%, partly because pickup services are common.
The things small enough to keep at home are collected least: lamps 5%, small equipment 12%, small IT 22%. They end up in drawers and boxes.
Inside one phone
A phone is one of those small devices. Most of its weight is plastic and ceramics; metals make up 28%.
| Material | Share of weight | Group |
|---|---|---|
| ABS-PC | 29% | Plastics |
| Ceramics | 16% | Ceramics |
| Copper and compounds | 15% | Metals |
| Other metals | 10% | Metals |
| Silicon plastics | 10% | Plastics |
| Epoxy | 9% | Plastics |
| Other plastics | 8% | Plastics |
| Iron | 3% | Metals |
28%
of a phone's weight is metal
Copper, iron and other metals. Gold is in there too, but only about 0.034 g per phone, too small to see at this scale.
Share of a phone's weight, by material.
Source: WEF & PACE (2019); US EPA (2015).
What it's worth
$91 billion
The e-waste thrown out in 2022 held an estimated $91 billion worth of metals. Gold alone was worth about $15 billion, and every million phones recycled can return 75 pounds of gold. Copper and iron were worth even more.
Value of metals in the e-waste generated in 2022
Together $91 billion. Source: Global E-waste Monitor 2024 (gold, copper, iron); Statista (nickel, aluminum, palladium, other).
| Name | Value (billion USD) |
|---|---|
| Gold | $15B |
| Copper | $19B |
| Iron | $16B |
| Nickel | $14B |
| Aluminum | $11B |
| Palladium | $8B |
| Other | $8B |
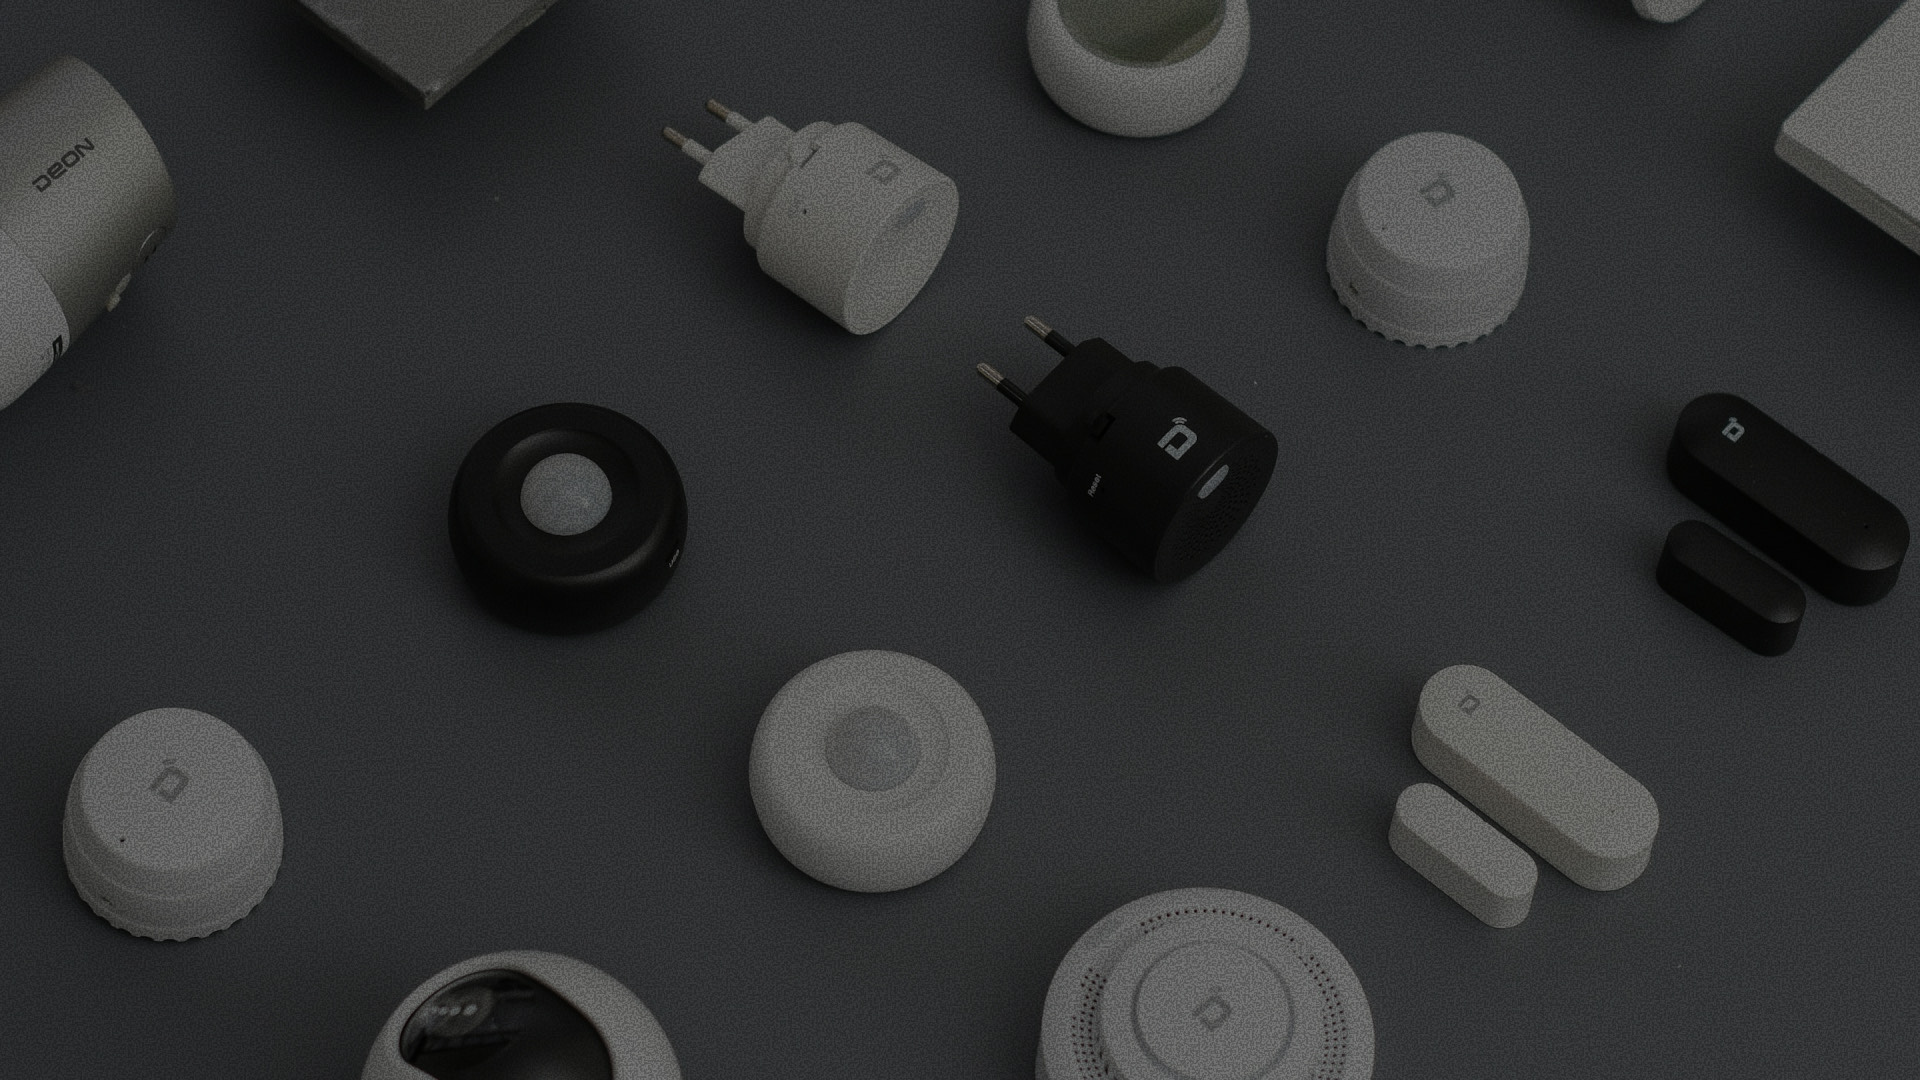
At home
How can we contribute to formal e-waste collection from home?
Electronics in the average European home, 2022
Share of each type of device kept unused at home, 2022
- 61 in use
- 13 no longer in use
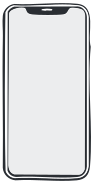


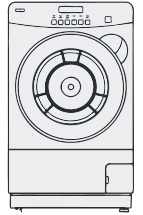
1 tile = 1 device; average of 8,775 households in six European countries, lamps excluded. Source: Baldé et al. (2022), UNITAR / WEEE Forum.
| All devices | 74 |
|---|---|
| In use | 61 |
| No longer in use (kept, working or broken) | 13 |
| Small IT | 17% |
|---|---|
| Small equipment | 14% |
| Screens and monitors | 14% |
| Large equipment | 9% |
| Temperature exchange | 8% |
A 2022 survey of 8,775 European households found 74 devices in the average home, and 13 of them no longer in use. Small IT, like old phones, routers and chargers, is the most likely to sit unused.
Most of us have at least one of these in a drawer.
Return one phone or small appliance, and its materials go back into use instead of into a landfill.
Take action
Find a place to drop off your old electronics
Earth911Use the button to enter your ZIP code and item, then see nearby official electronics recycling locations and learn how to prepare your drop off.
Outside the US? Search "e-waste drop-off" with your city's name, or check your local government's recycling page.
References
Department of toxic substances control
https://dtsc.ca.gov/electronic-hazardous-waste/E-Waste in Transition - From Pollution to Resource
https://www.intechopen.com/chapters/49287EMEW Clean Technologies
https://emew.com/blog/global-e-waste-statisticsGlobal E-waste Monitor 2024
Baldé, C.P. et al. (2024), ITU and UNITAR. Used for the tile pile flows (13.8, 16, 18 and 14 billion kg), the share outside formal recycling (78%), the category charts, sub-regional collection rates (Table A2.2; the Latin America and Caribbean rate is calculated from its sub-regions) and the country map (Table A2.4). Also the yearly toxic releases from non-compliant handling: 58,000 kg of mercury and 45 million kg of plastics containing brominated flame retardants.
https://globalewaste.org/ https://www.itu.int/pub/D-GEN-E_WASTE.01-2024Statista (2024), based on the Global E-waste Monitor 2024
Charts on e-waste generated (2014–2030), per person and by region. Values for 2020 and 2021 are Statista estimates; the 2030 figure is a projection. Also the value of metals in 2022 e-waste ($91 billion, by metal) and the top 20 countries by e-waste per person (statistic ID 499945).
U.S. Environmental Protection Agency (2015)
Materials recovered from recycled smartphones: 75 lb of gold per million phones. The phone chart's gold per phone (about 0.034 g) is calculated from this figure.
The World Counts
https://www.theworldcounts.com/stories/electronic-waste-factsWorld Health Organization
https://www.who.int/news-room/fact-sheets/detail/electronic-waste-(e-waste)WEEE Forum (2022), Update of WEEE Collection Rates, Targets, Flows, and Hoarding
https://weee-forum.org/wp-content/uploads/2022/12/Update-of-WEEE-Collection_web_final_nov_29.pdfWorld Economic Forum & PACE (2019), A New Circular Vision for Electronics: Time for a Global Reboot
Phone material composition from Figure 1, p.7. The figure credits the Global E-waste Monitor 2017, but that report does not include these phone percentages; the original data source is not specified.
https://www3.weforum.org/docs/WEF_A_New_Circular_Vision_for_Electronics.pdfNatural Earth, via world-atlas
Country boundaries for the world map (public domain).
https://www.naturalearthdata.com/Photos
Cover illustration: Sue Min Hong
Bulat843 on Pexels
Stas Ostrikov on Unsplash
Compagnons on Unsplash